Performance Tracing
Gatsby allows a build to be traced, enabling you to find which plugins or parts of the build are taking the longest. The trace information can be viewed in any OpenTracing compatible tool such as Jaeger. You can also use Zipkin compatible tools such as Zipkin or Honeycomb.
Running Gatsby with tracing turned on
Gatsby code is instrumented with OpenTracing, which is a general tracing API that is implementation agnostic. Therefore, you’ll need to include and configure an OpenTracing compatible library in your application, as well as a backend to collect the trace data.
In addition, Gatsby has additional tracing for GraphQL resolvers. This traces every resolver and might have performance impact, so it’s disabled by default. You can enable it with --graphql-tracing argument for the build command.
The steps required to add tracing are below. Or, you can skip ahead if you want specific instructions for Jaeger or Zipkin.
1. Library dependency
Add an OpenTracing compatible library to your site’s package.json dependencies.
2. Library configuration file
Each OpenTracing library must be configured. For example, what is the URL of the tracing backend? How often should spans be sent to the backend? What service name should the trace be recorded under? Etc.
The configuration file is a JavaScript file that exports two functions: create and stop.
- create: Create and return an OpenTracing compatible tracer. It is called at the start of the build.
- stop: Called at the end of the build. Any cleanup required by the tracer should be performed here, such as clearing out any span queues and sending them to the tracing backend.
3. Start Gatsby with tracing turned on
The above configuration file can be passed to Gatsby with the --open-tracing-config-file command-line option or an environment variable named GATSBY_OPEN_TRACING_CONFIG_FILE. When Gatsby is started with this option, it will load the supplied tracing configuration file, and call its create function. The returned Tracer will be used for tracing the build. Once the build has stopped, the configuration file’s stop method will be called, allowing the tracing implementation to perform any cleanup.
Tracing backend examples
There are many OpenTracing compatible backends available. Below are examples of how to hook Jaeger or Zipkin into Gatsby.
OpenTelemetry
OpenTelemetry is the new industry standard for tracing. Most vendors now have built-in support for OpenTelemetry. The following is an example of configuring Gatsby to send build traces to Honeycomb.
- Install necessary dependencies
- Create a file named
tracing.jsin the root of your site with the following code (adding your honeycomb API key and database).
- OpenTelemetry includes a built-in collector which needs to be started first. So we run Gatsby in a special way telling Node to require our tracing file immediately.
Local Jaeger with Docker
Jaeger is an open source tracing system that can be run locally using Docker.
Add jaeger-client to your site:
or
Run Jaeger’s all-in-one Docker instance with:
See Jaeger getting started for more information.
Start Gatsby
buildordevelopwith--open-tracing-config-filepointing at the Jaeger configuration file. An example file is provided in the Gatsby project under node_modules/gatsby/dist/utils/tracer/jaeger-local.ts that will send tracing spans to your local Docker instance over HTTP. E.gOnce the build is complete, view your tracing information at
http://localhost:16686. On the left menu, select thebuildoperation to see your build’s root trace.
Local Zipkin with Docker
Zipkin is an open source tracing system that can be run locally using Docker.
Add following dependencies to your site’s
package.jsonRun Zipkin’s all-in-one Docker instance with
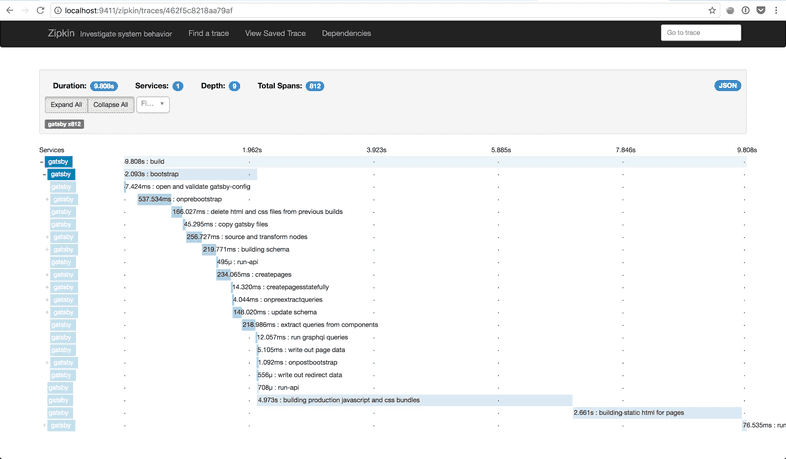
docker run -d -p 9411:9411 openzipkin/zipkin. See Zipkin getting started for more information.Start Gatsby
buildordevelopwith--open-tracing-config-filepointing at the Zipkin configuration file. An example file is provided in the Gatsby project undernode_modules/gatsby/dist/utils/tracer/zipkin-local.jsthat will send tracing spans to your local Docker instance. E.gOnce the build is complete, view your tracing information at
http://localhost:9411
Adding your own tracing
The default tracing that comes with Gatsby can give you a good idea of which plugins or stages of the build are slowing down your site. But sometimes, you’ll want to trace the internals of your site. Or if you’re a plugin author, you might want to trace long operations.
To provide custom tracing, you can use the tracing object, which is present in the args passed to API implementers. This tracing object contains a function called startSpan. This wraps OpenTracing startSpan, but provides the default childOf: parentSpan span args. startSpan returns a span object that you must explicitly end by calling its .finish() method. For example:
With this span, you can perform any OpenTracing span operation such as span.setTag. Make sure that the tracing backend supports these operations. You can provide an optional second span options argument to startSpan which will be passed to the underlying OpenTracing call.
For advanced use cases, the tracing object also provides tracer and parentSpan fields. You can use these to construct independent spans, or your own child spans (see the OpenTracing project for more info).
